N.º 19 - junho 2019
Carlos Farinha Rodrigues
Lisbon School of Economics and Management (ISEG)
and Centre for Applied Mathematics and Economics (CEMAPRE) of Universidade de Lisboa.
Rua Miguel Lupi 20, 1249-078 Lisboa, Portugal.
Email: carlosfr@iseg.ulisboa.pt
Abstract: The most recent studies on inequality, poverty and social exclusion in Portugal do not explore their regional variations. The main reason for this omission is the lack of data at regional level in the EU-SILC. This survey includes, however, a variable on the degree of urbanisation of the place of residence of households that is used in this paper as a proxy for the location. This study shows that location does matter: the average equivalised income in the cities is 35-40% higher than in predominantly rural areas, where the levels of poverty and social exclusion are higher. It is also shown that the deep economic crisis that occurred in Portugal after 2010 had a greater impact on the most urban areas. The existence of different poverty profiles according to location is also investigated.
Keywords: degree of urbanisation, poverty, inequality, social exclusion, Portugal.
Resumo: Os estudos mais recentes sobre desigualdade, pobreza e exclusão social em Portugal não têm tido em conta a dimensão espacial nas suas análises. A razão principal para esta omissão prende-se com a ausência de informação regional na principal fonte de informação estatística que serve de base a esses estudos, o EU-SILC. Este inquérito inclui, no entanto, uma variável acerca do grau de urbanização do local de residência das famílias que é utilizada neste artigo como proxy para a localização. O estudo realizado mostra que a localização efectivamente conta: o rendimento equivalente médio nas zonas mais urbanizadas é 35-40% mais elevado que o das zonas predominantemente rurais, onde os níveis de pobreza e exclusão social são mais elevados. Demonstra-se igualmente que a profunda crise económica ocorrida em Portugal após 2010 teve um impacto superior nas áreas mais urbanas. A existência de diferentes perfis de pobreza de acordo com a localização é igualmente investigada, ainda que de forma preliminar.
Palavras chave: grau de urbanização, pobreza, desigualdade, exclusão social, Portugal.
Introduction[1]
The most recent studies on Portuguese poverty, social exclusion and social inequality do not explore their regional variations. The crucial reason for this omission is the lack of data at regional level in the Portuguese component of the Survey on Income and Living Conditions (EU-SILC),[2] the official data source used to calculate the main statistical poverty indicators in the EU countries.
The only available information on poverty incidence and intensity at regional level in Portugal comes from INE’s five-yearly Household Budget Survey (HBS). Using this data, Pereira (2010) and Rodrigues, Figueiras and Junqueira (2012) find that poverty and inequality exhibit significantly different levels and patterns across the Portuguese NUTS regions. These results are confirmed by the most recent HBS survey of 2015/16 in INE (2017). They show that the (monetary income) poverty rate varies between a low of 15.4% in the Lisbon Metropolitan Area and a high of 28.3% in the Autonomous Region of the Azores, whilst the Gini coefficient varies between 31.1% in the least unequal area, Alentejo, and 37.8% in the most, Lisbon Metropolitan Area.
The primary aim of this paper is to investigate how important the location of the households is to the analysis of income distribution, inequality and poverty using the EU-SILC data. As mentioned above, no regional level data is available in the EU-SILC, but it includes a variable on the degree of urbanisation that can be used as a proxy for location. Moreover, the analysis of whether the poverty profiles differ substantially between the more and less densely populated areas provides a first approach to the identification and differentiation between traditional and new and emergent forms of poverty. An additional aim of this paper is to analyse the effects of the economic crisis and austerity policies of the 2011-14 period on poverty by degree of urbanisation.
This paper is organised as follows: section 2 discusses the main indicators of poverty and social exclusion plus the concept of degree of urbanisation as defined in the EU-SILC; section 3 analyses the evolution of these indicators by degree of urbanisation in Portugal in 2011-16 and briefly compares it with that in other EU countries; section 4 analysis the (latest available) EU-SILC of 2016 in greater detail; and finally section 5 summarises the key results and discusses their impact on the social policies that aim to reduce poverty and social inequality.
Poverty, social exclusion and degree of urbanisation indicators
The poverty and social exclusion indicators used in this paper are calculated using the data collected by annual surveys which focus on the analysis of monetary income. Since 2004, INE Statistics Portugal is part of the “European Union Statistics on Income and Living Conditions survey” (EU-SILC). It follows specific EU legislation and defines a harmonised system to produce EU wide statistics on poverty, deprivation and social exclusion.
The Portuguese component of the EU-SILC aims to obtain results for all individuals residing in the Portuguese territory in the reference period. Households are selected from a sampling frame of usual residence dwellings using a stratified two-stage sampling method. For example, in 2017, the survey was conducted by full interview on 12,091 households, signifying that data was collected on 30,007 individuals of which 25,848 were aged 16 and over. The final estimated results are obtained using both household and individual weights, calibrated by region, household size, age, and gender. Therefore, all results are extrapolated to a population of more than 4.1 million households and 10.3 million individuals.
The definition of the concept of income is the starting point in the evaluation of the resources available to each household. The EU-SILC adopts the concept of net monetary income. It is defined as the monetary income received by the household and each of its members individually from work (employee wages and self-employment earnings), other private income (capital, property and private transfers), pensions, and other social transfers, all net of taxes and social security payments.
Next, the equivalised adult income is obtained from the household net monetary income using the OECD modified equivalence scale. For each household, it gives a weight of one to the first adult, 0.5 to all other adults, and 0.3 to each child. The use of an equivalence scale harmonises household data in terms of their dimension and age structure, thus making comparisons possible. These are based on a single person household standard, meaning that the equivalised income of a single person household coincides with its actual net monetary income; in households with more than one individual, the equivalised adult income is equal to the income that would guarantee to each of its members, if they lived alone, the same income as the one the household provides to them all when living together.
In practice, the equivalised income of each household member is calculated by dividing the net total household income by its size expressed in equivalent adult numbers. Thus, the value of the equivalised adult income is the same for each household member, irrespective of whether the individual is an adult or a child. The usage of an equivalence scale removes, to some extent, the effects of economies of scale obtained by co-habitation and the extra costs incurred with living with children.
The main estimated indicator of the population’s poverty, or of any of its sub-groups, is the poverty rate[3]. It is defined as the proportion of the population whose adult equivalised income is below the poverty threshold (or poverty line) which, in turn, is defined as 60% of the median equivalised income. This poverty indicator should be complemented by that of poverty intensity, which analyses how far below the poverty line the poor are. It is defined as the difference between the median equivalised income of the individuals that are poor and the value of the poverty threshold, expressed as a percentage of the same threshold. Using these two indicators together clarifies two important poverty dimensions, as the following simple example illustrates. Given a poverty threshold of 400 euros and two individuals with equivalised incomes of 300 euros and 100 euros, respectively, both of them are classified as poor, but the economic vulnerability of the latter is much higher than that of the first individual. The calculation of the poverty intensity uncovers this distinction through the quantification of the relative distance between each income and the poverty line or, equivalently, by calculating the proportion of resources each individual requires to stop being poor.
The lack of monetary resources is a determinant factor in the evaluation of the living conditions of individuals and households but does not encapsulate all circumstances that can lead to social exclusion. The second dimension of social exclusion is the capacity of a household to satisfy a set of basic needs and purchase essential goods and indicates its level of material deprivation. The EU methodology bases this measure on a group of nine items:
- Inability to fulfil the immediate payment (without a loan) of an unexpected expense of a value close to the monthly poverty line;
- Inability to afford one-week annual holiday away from home, including accommodation and travelling expenses, for all household members;
- Arrears in some of the regular payments of rent, mortgage or running costs of the main home, or other expenses not related to the main home, due to financial difficulties;
- Inability to afford a meat, chicken, fish or vegetarian equivalent meal every other day;
- Inability to keep home adequately warm due to financial difficulties;
- Enforced lack of a washing machine due to financial difficulties;
- Enforced lack of a colour TV due to financial difficulties;
- Enforced lack of a telephone, landline or mobile, due to financial difficulties;
- Enforced lack of a personal car, family car or mixed usage vehicle due to financial difficulties.
An individual or household are considered materially deprived if they suffer from an enforced lack of at least (any) three of the nine items, and are severely materially deprived if that number of items is raised to (any) four or more. Therefore, the material deprivation and the severe material deprivation rates are defined as the proportion of the population in either of these situations, respectively. Again, the analysis of the incidence indicator can be complemented by a measure of its intensity: the material deprivation intensity is defined as the average number of items the deprived individuals are actually deprived of. However, this concept of material deprivation is not without criticism, in particular because it weighs equally all selected items. A critical evaluation of these indicators in a Portuguese context can be found in Rodrigues and Andrade (2012) and Rodrigues (2014).
A third dimension of social exclusion included in the European statistical system relates to the non-participation in the labour market of individuals of working age. A household is said to be of very low per capita work intensity when its adult members (aged 18-59, excluding students) work, on average, less than 20% of the total possible working hours. This indicator measures the disconnection (or non-inclusion) of the individuals from the labour market, rather than unemployment.
Finally, the poverty or social exclusion rate is defined as the proportion of the population that is in, at least, one of the three situations defined above: poverty, living in very low work intensity households, or in severe material deprivation. Thus, this indicator summarises all three dimensions of poverty: monetary poverty, weak connection to the labour market, and material deprivation, and emphasises the multidimensional character of social exclusion.
It is important to note that the poverty or social exclusion rate combines two indicators (poverty rate and very low per capita work intensity) calculated using information of the income reference year with one indicator (severe material deprivation rate) that uses the information of the survey year.
The adoption of a multidimensional poverty indicator, the poverty or social exclusion rate, represents a substantial conceptual step up from a one-dimensional indicator, the poverty rate, which is based solely on the income distribution. However, its three-dimensional definition makes it particularly vulnerable to criticism. For example, it is questionable that an individual that does not participate in the labour market, i.e., is a member of a low work intensity household, but has an equivalised income above the poverty line and is not materially deprived, is nonetheless officially considered socially excluded.
The EU-SILC includes a degree of urbanisation variable since its start in 2004, but the methodology used to construct its various categories was substantially altered in 2012. Therefore, this paper covers the shorter 2012 to 2017 (latest available results) comparable period. Furthermore, the analysis is always denoted to 2011-16 because the main variables used in the study of poverty and inequality are based on the income of the previous (not current) year.
The EU-SILC degree of urbanisation variable divides all ‘local administrative units’ (in Portugal: concelhos) into three categories, which are compatible with NUTS and ensure geographical continuity[4]. The three categories are:
I. Cities (also: ‘densely populated area’, ‘large urban area’) defined as contiguous one square km grid cells with a minimum population of 50,000 and minimum density of 1,500 inhabitants per square km;
II. Towns and suburbs (also: ‘intermediate area’, ‘small urban area’) defined as clusters of contiguous one square km grid cells with a minimum population of 5,000 and minimum density of 300 inhabitants per square km;
III. Rural area (also ‘thinly-populated area’) defined as the remnant area.
Using this classification, in 2017, 4.5 million Portuguese lived in cities, corresponding to 43.6% of the population, 3.1 million, corresponding to 30.2%, lived in towns and suburbs (here-after ‘suburbs’), and 2.7 million, or 26.3%, lived in rural areas.
Evolution of the main indicators of poverty, social exclusion and inequality, 2011-16
This section investigates the evolution of the main indicators of the living conditions of the population according to the degree of urbanisation in 2011-2016. Hence, it includes the deep impact on the living conditions of the households of one of the deepest Portuguese socio-economic crises[5]. The evolution of the real disposable equivalised income by degree of urbanisation in 2011-16 is shown in Figure 1.

Figure 1 Real Disposable Equivalised Income, Portugal, 2011-16 in euros/year and 2016 prices
Source: Author’s calculations using anonymised EU-SILC microdata, 2012-17.
Between 2011 and 2013, the national average real equivalised income fell 6.5% in real terms, but the fall in the incomes of the city dwellers was higher, 10.3%, than that of those living in either suburbs, 3.2%, or rural areas, 3.7%. A possible explanation for this difference is the large rise in unemployment in the cities due to the economic crisis. Conversely, between 2013 and 2016, the equivalised income increased 9.3% in the cities, but this was not enough to compensate for the previous losses. Whilst the economic crisis affected more the cities households’ incomes, the recovery starting in 2014 has had a more even impact, with incomes rising in all areas. Finally, the average national real equivalised disposable income in 2016 was equal to 102.0% of its 2011 (crisis) level, but only to 94.4% of its 2009 (pre-crisis) level.
Figure 2 describes the monetary poverty incidence by degree of urbanisation in 2011-16. Throughout this period, the highest poverty incidence is recorded in the rural areas, with a rate always above 20% and staggeringly 4-7% above the national rate.

Figure 2 Poverty Incidence, Portugal, 2011-16
Source: Author’s calculations using anonymised EU-SILC microdata, 2012-17.
During the most severe period of the crisis (2011-13), the poverty incidence rose by 3.5 percentage points (pp here-after) in the cities, 1.5 pp in towns and suburbs, and fell slightly, -1.2 pp, in the rural areas. The sharp decrease in the incomes of households living in the cities, discussed in Figure 1, naturally led to an increase in their poverty intensity, which increased almost 20%, from 14.6% in 2011 to 18.1% in 2013. The small reduction in the rural poverty rate can be explained by a smaller drop in the rural household income, together with the small decrease in the (national) poverty threshold caused by the decrease in the median income (see Rodrigues, Figueiras and Junqueira (2016) for a detailed discussion).
Hence, the increase in the poverty rate between 2011-13 was strongly driven by the increase in the poverty of the cities households and, to a smaller degree, by those living in suburbs. The rural population remained relatively immune to this increase in monetary poverty, suggesting that the main factors driving urban and rural poverty are different and specific to the characteristics of the households living in these area types. Moreover, during 2014-16, when the national poverty rate fell by about 1.2 pp, the fall in the city areas was smaller than in the others, revealing longer lasting effects of the crisis in the most urbanised areas. This dissimilar evolution of the poverty rate according to the degree of urbanisation is reflected in the regional distribution of the population living in poverty, as shown in Figure 3.

Figure 3 Distribution of the Poor Population by Degree of Urbanisation, Portugal, 2011-16
Source: Author’s calculations using anonymised EU-SILC microdata, 2012-17.
At the start of the period, about 40% of the Portuguese poor lived in rural areas but, by 2016, this proportion had dropped to about 1/3. On the other hand, the proportion of poor who are city dwellers increased from 35% to 42% over the same period.
These differences in the poverty incidence by degree of urbanisation are transferred, but in reverse order, to the inequality of the income distribution, as measured by the Gini coefficient. Figure 4 shows the estimated Gini for each urbanisation level in this period and, as expected, it is the incomes of the households living in the cities that are the most unequal. Their Gini is consistently above 35%, whereas the rural values are below 31%.
Furthermore, Figure 4 indicates a relatively stable income inequality[6], with an overall, variation that never exceeded 1 pp. In fact, in 2011-13, the Gini of the cities household incomes fell slightly, whereas that of both suburbs and rural households recorded a small increase.

Figure 4 Gini Coefficient, Portugal, 2011-16
Source: Author’s calculations using anonymised EU-SILC microdata, 2012-17.
All results above confirm that the degree of urbanisation of the location of the households has a significant impact on their income distribution, living conditions, and monetary poverty incidence. They also reveal the disparity in the impact of the economic crisis by degree of urbanisation: households living in the more densely populated areas were more affected, with larger decreases in their equivalised income and correspondingly larger increases in their poverty rate.
How do these Portuguese results compare with those of the other EU countries? Does location also have an important effect on income distribution and poverty across the EU? Recent papers, like Eurostat (2016) and Weziak-Bialowolska (2016), use the variable ‘degree of urbanisation’ to analyse poverty and social exclusion in EU countries. In an analogous way, Figure 5 compares the poverty rate by degree of urbanisation across the EU countries in 2015 (countries ordered by increasing national poverty rate level, left to right) and suggests a strong link between the national poverty rate level and its range by degree of urbanisation.

Figure 5 Poverty Rate by Degree of Urbanisation, EU, 2015
Source: Eurostat, EU-SILC, 2016.
In general, the countries with higher national poverty rates also record wider differences between urban and rural poverty rates. All countries with a national rate above the EU28 average have highest poverty rates in the rural areas, including Portugal and most southern European countries. On the contrary, seven countries (Denmark, the Netherlands, Austria, Belgium, UK, Germany, plus Malta) have higher poverty rates in cities; and only five (Czech Republic, France, Cyprus, Ireland, and Luxembourg) record higher poverty rates for households living in suburbs. All these reflect, to a large extent, country and cultural specific characteristics (inner-city decline, big cities suburbs, depopulation of the countryside, even country size) and raise important issues beyond the scope of this paper.
Living in the big city or in the countryside — Does it make you poorer?
The aim of this section is to analyse in greater detail how the location of the Portuguese households shapes the income distribution and impacts on the poverty incidence and social exclusion. This analysis uses the latest available anonymised EU-SILC microdata of 2017 (2016 monetary data).
Starting with the equivalised income, Table 1 shows how its level and distribution are affected by the degree of urbanisation. The average income of the households living in the cities is about 16% higher than that of households living in suburbs, and more than 35% higher than that of rural households.
Table 1 Disposable Equivalised Income by Degree of Urbanisation, Portugal, 2016, in euros/year

Source: Author’s calculations using anonymised EU-SILC 2017 microdata.
A first insight into the asymmetry of the equivalised income distribution is given by its different percentiles by area type. For example, the 10% poorest individuals living in the cities earn about € 349/month, nonetheless 12% higher than the about € 311 earned by those living in the countryside. At the other end of the distribution, the 10% urban wealthiest earn about € 1861/month, more than 1.5 times what their rural counterparts earn, at about € 1212/month. Average incomes of the households living in the intermediate area (suburbs) are also mostly in between the other two.
A more comprehensive analysis of these asymmetries involves the graphic analysis of the income distributions by degree of urbanisation and identification of their main characteristics. The direct observation of their plots indicates whether the (three) distributions are more or less concentrated, if they have various cumulative points or whether most households are situated in their central parts, for example.
In this paper, the chosen statistical method to estimate the density functions is the (non-parametric) kernel method[7] which does not impose a priori restrictions on the income distribution functional form. This means that, for example, the estimated distributions can have more than one mode, fatter or thinner tails, or be more or less asymmetric. However, for ease of plotting and comparison of the three estimated income densities, incomes above € 40,000/year are truncated in Figure 6, thus avoiding a full-length plot of the right tail of the distribution. In fact, this excludes only about 1% of the households: 1.8% of the urban households and less than 0.5% of the other two areas.
The plots of all three income distributions in the defined income space are very close to a log-normal type distribution, as seen in Figure 6. It also shows a distinct shift to the right (towards the highest incomes) in the cities households’ incomes compared to the suburbs and rural households, whereas the latter are more concentrated in the left part of the distribution (incomes below € 10,000/year).

Figure 6 Equivalised Income Density by Degree of Urbanisation, Portugal, 2016
Source: Author’s calculations using anonymised EU-SILC microdata, 2017.
The effect of the degree of urbanisation on the income distribution inequality can also be analysed by estimating the proportion of the population living in each area type by decile of the global income distribution, as reported in Table 2. Almost 28% of the population living in the cities are in the top two (wealthiest) income deciles, but only 10.4% of the rural dwellers are in the same position. The opposite occurs in the lower part of the distribution, with less than 20% of the urban and 25% of the rural populations, respectively, in the first two (poorest) deciles. Whilst 60.4% of the rural population are in the 1st-5th deciles, that proportion drops to 50.6% in the suburbs and 43.4% in the cities. These results reinforce the conclusion that, whichever methodology is used, household incomes are higher in the most urbanised area, and that there is a far greater proportion of urban households in the top income deciles than elsewhere.
Table 2 Distribution of the Population by Adult Equivalent Income Deciles and Degree of Urbanisation,
Portugal, 2016, in %
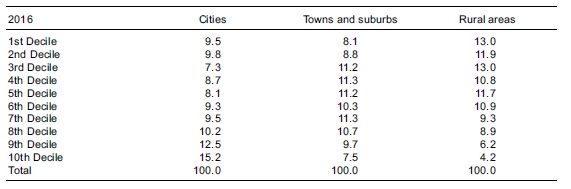
Source: Author’s calculations using anonymised EU-SILC 2017 microdata.
The poverty and social exclusion indicators estimated in Table 3 using the EU-SILC 2017 data naturally reflect the differences in level and distribution of income across the degrees of urbanisation already discussed, particularly those derived directly from the household incomes. Still, additional caution is needed in the analysis of these indicators because poverty and low work intensity measures are based on the 2016 incomes, material deprivation on the households’ perceptions in 2017, and the poverty and social exclusion rate (summarising all three, as discussed above) combines information from 2016 and 2017.
Table 3 Poverty, Material Deprivation and Social Exclusion, Portugal, 2016, in %

Source: Author’s calculations using anonymised EU-SILC 2017 microdata.
In 2017, according to the EU-SILC results, 2.4 million Portuguese lived in poverty or social exclusion, 43% of them in the cities, 26% in suburbs, and 31% in rural areas. However, the highest poverty or social exclusion rate is recorded in the rural areas, 27.5%, 7.8 pp and 4.3 pp higher than that in suburbs and cities, respectively. As this rate is dominated by monetary poverty, it is the (top) rural poverty rate of 22.9% that explains this outcome. The poverty intensity is more similar across degree of urbanisation, but is still highest for rural households, exposing a larger poverty deficit in the countryside. However, the material deprivation indicators identify the cities households as the most vulnerable, both in terms of its incidence and intensity. Finally, rural households are characterised by lower work intensity, but this result may be substantially affected by demographics: a lower percentage (less than 70%) of the rural population is of working age (18-59 years old excluding students) compared to the rest of the country.
These results indicate a clear contrast between the most and least urbanised areas: as rural areas are abandoned in favour of urban life, they support an ever-smaller proportion of the population that earn lower incomes and suffer from higher poverty and social exclusion. It is important now to investigate whether these contrasting living conditions are connected with specific profiles of socio-economic vulnerability and poverty, and whether the detected differences between cities and rural households represent two actually distinct poverty and social exclusion profiles. Answering this question is essential for a more accurate identification of the target populations and improve the design of the public policies aimed at fighting poverty and social exclusion, and is pursued in Tables 4 and 5. Each table is divided into three sections: the 1st investigates poverty by age group, the 2nd by household type, and the 3rd by employment status (individuals aged 18+).
Table 4 Poverty Incidence, Portugal, 2016, in %

Source: Author’s calculations using anonymised EU-SILC 2017 microdata.
N.B.: The 3rd section of the table only includes individuals aged 18+.
Table 5 Distribution of the Population that are Poor, Portugal, 2016, in %

Source: Author’s calculations using anonymised EU-SILC 2017 microdata.
N.B.: The 3rd section of the table only includes individuals aged 18+
The distribution of the population by age group shows that there is a higher proportion of elderly (aged 65+) in the rural areas. The latter represent almost a quarter of the rural population, compared with a national proportion of 21.1%, while a smaller proportion of children and youngsters (aged 0-17) live in the countryside. These similarities in the population distribution by degree of urbanisation do not extend to the income distribution and monetary poverty. Excluding the youngest age group, Table 4 shows that the rural poverty rates are always highest, and even more so for the elderly groups. The poverty rate of the rural older old (aged 75+) of 28.1% is 10 pp above the national rate (18%), and well above that of cities (15.8%) and suburbs (18.3%); the same happens, although at a lower level, in the younger old (aged 65-74) group. Together these results reveal the higher proportion of poor that are elderly living in rural areas compared to the remaining areas, but also partially explain why poverty did not increase as much in the rural areas during the economic crisis, when it was largely driven by substantial increases in (working age) unemployment. In contrast, there are proportionally less poor children and young adults living in the rural areas (15%) than in the more urban areas (21-22%).
The analysis of poverty incidence and the structure of the poor population (2nd section of Tables 4 and 5) confirms the results by age group. In cities and suburbs, it is the households with children that have higher poverty rates (20.9% and 16.4%, respectively) whilst in the rural areas it is those without children (23.9%). The particularly high poverty rate of rural ‘one-person’ households (36.2%) cannot be interpreted separately from the age group analysis, with 2/3 of these single individuals aged 65+.
Although, the results by household type demonstrate that in almost all categories the poverty rate is higher in the rural areas, the dissimilar demographic patterns mean that child and youth poverty is more evident in cities and suburbs than in the countryside. In fact, the proportion of poor people living in households with children is highest in the suburbs, 59.8% of the total, followed by cities with 58.2%, and rural areas at a much lower 46.6%. Nonetheless, child poverty in the rural areas remains a crucial issue, particularly when more than half of the individuals living in rural households with three or more children are poor, well above that of cities and suburbs. Although their weight in the total rural population is small (6.1% of the total), their social vulnerability requires a specific approach.
The last section of Tables 4 and 5 addresses the relationship between degree of urbanisation and employment status of individuals aged 18+. Again, the highest poverty rates occur for those living in the rural areas: 52.7% of the rural unemployed and 21.7% of those retired are poor, well above the proportions in the urban areas. The latter reveal how the lower rural pensions are less effective at relieving poverty than in the cities and suburbs, which record much lower proportions of retired poor. The 4-5% higher proportion of rural retired/inactive individuals that are poor also reflects a faster ageing process and withdrawing from formal occupation in the countryside.
Conclusion: Location matters!
This paper is a much needed first attempt at analysing how the location of the households influences their levels of income, poverty and social exclusion using the ‘degree of urbanisation’ variable available in the EU-SILC.
The short answer to the title of the paper “Does location matter?” is an unequivocal “Yes”. The results indicate that the average adult equivalised income in the cities is 35-40% higher than that in the rural areas, further influenced by a higher concentration of the highest incomes (and income inequality) in the urban areas; poverty incidence and social exclusion is higher in the countryside, with a rate 4.3 pp and 7.8 pp above that of cities and suburbs, respectively. Conversely, Eurostat’s material deprivation indicators are highest in the cities, although it is arguable whether they mostly reflect actual situations, higher expectations, or even the inadequacy of the indicators themselves to reflect specific regional issues. Further research is clearly required.
Another important result is a preliminary evaluation of the crisis effects on the living conditions of individuals living in different area types. It suggests a greater impact on the urban areas, with a fall in the real equivalised cities household income of 10.3% between 2011-13, about 2.8 pp above that in the rural areas. In the same period, the poverty rate rose by 3.5 pp in cities, 1.5 pp in the suburbs, but fell slightly (-1.2 pp) in the rural areas. The latter reflects the non-uniform variation in the income levels across areas, the fall in the poverty line value itself (which fell by about 4% during the crisis, from €852 to €821/month), and specific regional transmission mechanisms, such as the rise in (urban) unemployment rate.
Finally, this paper set out to investigate if these distinct poverty levels and responses to the economic crisis across degree of urbanisation can, in turn, be ‘translated’ into two clear-cut different urban and rural households poverty profiles. There is no simple answer and further research is needed, but the current results point to a more ‘traditional’ poverty profile of the elderly and inactive population, which is more prevalent in the rural areas, and to a more ‘modern’ and urban profile, linked to high unemployment and extended households with children. Both profiles co-exist, but with variable incidence, in all three area types, thus creating an additional problem in the effective identification of the poverty and social exclusion dimensions and in the designing of social policies targeting poverty and promoting social inclusion.
References
Deaton, A. (1997). The analysis of household surveys — A microeconometric approach to development policy. Baltimore/ London: World Bank/Johns Hopkins University Press.
Eurostat. (2016). Urban Europe — Statistics on cities, towns and suburbs. Luxemburg: Eurostat. DOI: 10.2785/594675.
Eurostat. (2018). Degree of urbanisation classification — 2011 revision. Eurostat — Statistical explained. Luxemburg. Retrieved from: https://ec.europa.eu/eurostat/statistics-explained/index.php/Degree_of_urbanisation_classification_-_2011_revision
Góis, E. (2016). The way to NUTS 2 regional estimates in the Portuguese EU-SILC survey. Presentation to the SCORUS — Standing Committee on Regional and Urban Statistics 2016 Lisbon Conference, Lisbon.
INE. (2017). Inquérito às despesas das famílias 2015/2016. Lisbon: Instituto Nacional de Estatística.
Pereira, E. (2010). Contextos territoriais diferentes fazem a diferença no risco de pobreza em Portugal?. Revista Sociedade e Trabalho, 41, 111-124.
Rodrigues, C. F. (2014). Eurostat social indicators for the European community. In A. C. Michalos (Ed.), Encyclopedia of quality of life and well-being research (pp. 2045-2050). Dordrecht, Netherlands: Springer.
Rodrigues, C. F., & Andrade, I. (2012). Monetary poverty, material deprivation and consistent poverty in Portugal. Notas Económicas, 35, 20-39.
Rodrigues, C. F., Figueiras, R., & Junqueira, V. (2012). Desigualdades económicas em Portugal. Lisbon: Fundação Francisco Manuel dos Santos.
Rodrigues, C. F., Figueiras, R., & Junqueira, V. (2016). Desigualdade do rendimento e pobreza em Portugal: As consequências sociais do programa de ajustamento. Lisboa: Fundação Francisco Manuel dos Santos.
Silverman, B. W. (1986). Density estimation for statistics and data analysis. London: Chapman & Hall.
Weziak-Bialowolska, D. (2016). Spatial variation in EU poverty with respect to health, education and living standards. Social indicators research, 125, 451-479. DOI: 10.1007/s11205-014-0848-7.
Data de submissão: 04/09/2018 | Data de aceitação: 11/12/2018
[1]We acknowledge INE-Statistics Portugal for permission to use the EU-SILC microdata (Protocol INE/MCES, process 535). We also acknowledge constructive comments from two anonymous reviewers.
[2]This will be amended in the 2018 wave, when the EU-SILC will start including statistically significant information at NUT2 level. See Góis (2016) for details.
[3]The EU refers to the “poverty rate” as the “at-risk-of-poverty rate”, with the double objective of emphasising that this rate is an estimate of the number of individuals living in poverty and that poverty is not just the lack of monetary resources. However, this expression can be wrongly interpreted as a measure of potential, not actual, poverty.
[4]See Eurostat (2018) for details.
[5]The economic crisis started in 2010 and by 2011 household incomes had dropped significantly. The average equivalised income fell 13.7% between pre-crisis 2009 and 2013.
[6]Rodrigues, Figueiras and Junqueira (2016) find that the average income inequality as measured by the Gini coefficient remained relatively stable during the crisis. However, they demonstrate that inequality indicators that are more sensitive to the extremes of the income distribution detect a significant increase in income inequality in the 2010-14 period.
[7]See Silverman (1986) and Deaton (1997) for a description and detailed discussion of the estimation of density functions using non-parametric methods.
Autores: Carlos Farinha Rodrigues